Data Quality with a Qlik Sense Dashboard
The volume and sources of data continue to increase in companies; it is important to ensure that the data volume does not degrade the data’s quality. There is nothing worse for a business than making a decision based on poor quality data from its information system.
To avoid this situation, it is important to set up place actions to ensure the highest quality. I say the highest quality level because the 100% level does not exist except in tiny companies.
In this article, I will discuss data quality in the business intelligence process. Aspects related to data quality management in the production system will not be addressed.
Data quality problems cost US businesses more than $ 3 trillion a year.
Here is the summary of this article:
1. Dimensions of data quality
2. Data profiling
3. Data quality process
4. Build a data quality Dashboard with Qlik Sense
5. Automatically distribute data quality reports with Qalyptus
1- Dimensions of data quality
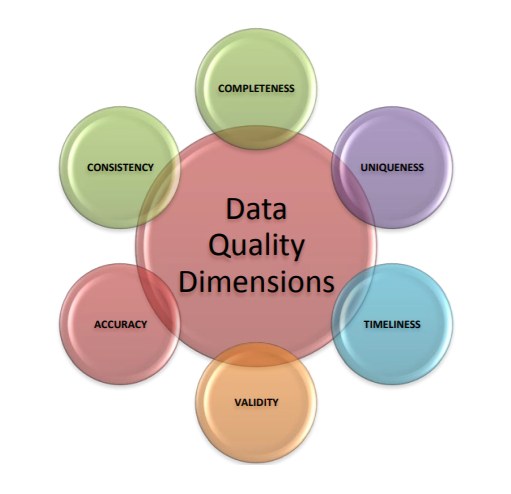
Understanding the key dimensions of data quality will help you assess your data and determine the extent of the root causes of data quality and whether you should go through data cleansing.
1.1- Completeness
Often in databases, there is missing data. But depending on the case, missing data can be a problem or not. If a customer’s first and last name is required, but the phone number is optional, a record may be considered complete even if the phone number is not available. If you are a bank and your customers need to use a phone number for two-factor authentication, the record should be considered incomplete.
There are no hard and fast rules; depending on your business requirements, you need to know what information needs to be complete.
1.2-Validity (conformity)
It is necessary to ensure that data of the same nature respect the same format to maintain a coherent structure and nomenclature for data sharing and internal management. If the transaction data contains the date and time, you must ensure that this is respected in all data sources.
1.3- Accuracy
Does the data match the actual expected values? Spelling mistakes, misplaced decimals, or out-of-date data can lead to inaccurate analysis. If a customer’s sales are not denominated in the correct currency or if a contact’s email address is misspelled, then the data is inaccurate.
1.4- Timeliness
It is important to ensure that the data is available within the set deadlines to not delay the entire data usage chain. If the Data warehouse is not updated on Monday at 5 a.m., all dashboards and reports that depend on the Data warehouse will not be refreshed with the new data.
1.5- Consistency
Does data from multiple systems reflect the same information? If the data comes from more than one system, it should have the same information. If one database flags a customer’s account as active, while another flags the account as closed, the dataset is not consistent.
1.6- Uniqueness
Some information must be uniquely recorded. Example: A customer’s email address cannot be registered twice in the database with different customer IDs.
2- Data profiling
At one time or another, a business will be confronted with data quality issues. It is best to anticipate and implement controls and corrective actions before suffering the consequences of using poor quality data.
Data profiling can be done in several ways: SQL script, programming language (python, C #, … etc.), or a data integration tool.
The more complex the information system, the more it is recommended to use more comprehensive tools.
2.1- Data profiling benefits
a- Better data quality and credibility
Once the data is analyzed, the application can help eliminate duplicates or anomalies. It can determine useful information that may affect business choices and identify quality problems in its information system.
b- Predictive decision making
The profiled information can be used to prevent small mistakes from turning into big problems. Data profiling helps create an accurate snapshot of a company’s health to inform the decision-making process better.
c- Proactive crisis management
Data profiling can help identify and resolve issues quickly, often before they occur.
d- Good data traceability
Profiling can trace data back to its source and ensure proper encryption for security. A data profiler can then analyze these different databases, source applications, or tables and ensure that the data meets standard statistical metrics and specific business rules.
2.2- Data profiling techniques
There are three distinct components of data profiling:
• Structure Discovery: Structure discovery helps determine if your data is consistent and correctly formatted. It uses basic statistics to provide information on the validity of the data.
• Content Discovery: Content discovery focuses on data quality. Data should be formatted and standardized. For example, if a mailing address is incorrectly formatted, it may mean that some customers cannot be reached or that delivery is not made.
• Relationship Discovery: Relationship Discovery identifies connections between different sets of data.
3- Data quality process
The data quality process goes through four main stages.

3.1- Define data quality requirements
It is about performing data profiling to help discover the frequencies and formats of the data. Data profiling can be done with specialized tools, query languages on data sources (SQL), or programming languages.
Data quality issues can be discovered during profiling, but profiling aims to uncover information for data quality assessment.
3-2. Data quality evaluation
In this step, we define the data quality rules concerning: accuracy, validity, completeness, etc., as well as quality thresholds.
Based on the predefined quality rules, perform a data quality assessment by conforming to the data set’s data quality rules.
3.3- Resolving data quality problems
For issues identified during the data quality evaluation, perform a root cause analysis to resolve the issues by eliminating their root cause.
3.4- Data quality monitoring and control
Finally, it is important to build Dashboards with data quality KPIs to track and monitor data quality.
4- Build a data quality Dashboard with Qlik Sense
Now I will show you an example of creating a data quality dashboard using Qlik Sense. Of course, you can use other BI tools (Tableau, Power BI, …) to create this dashboard.
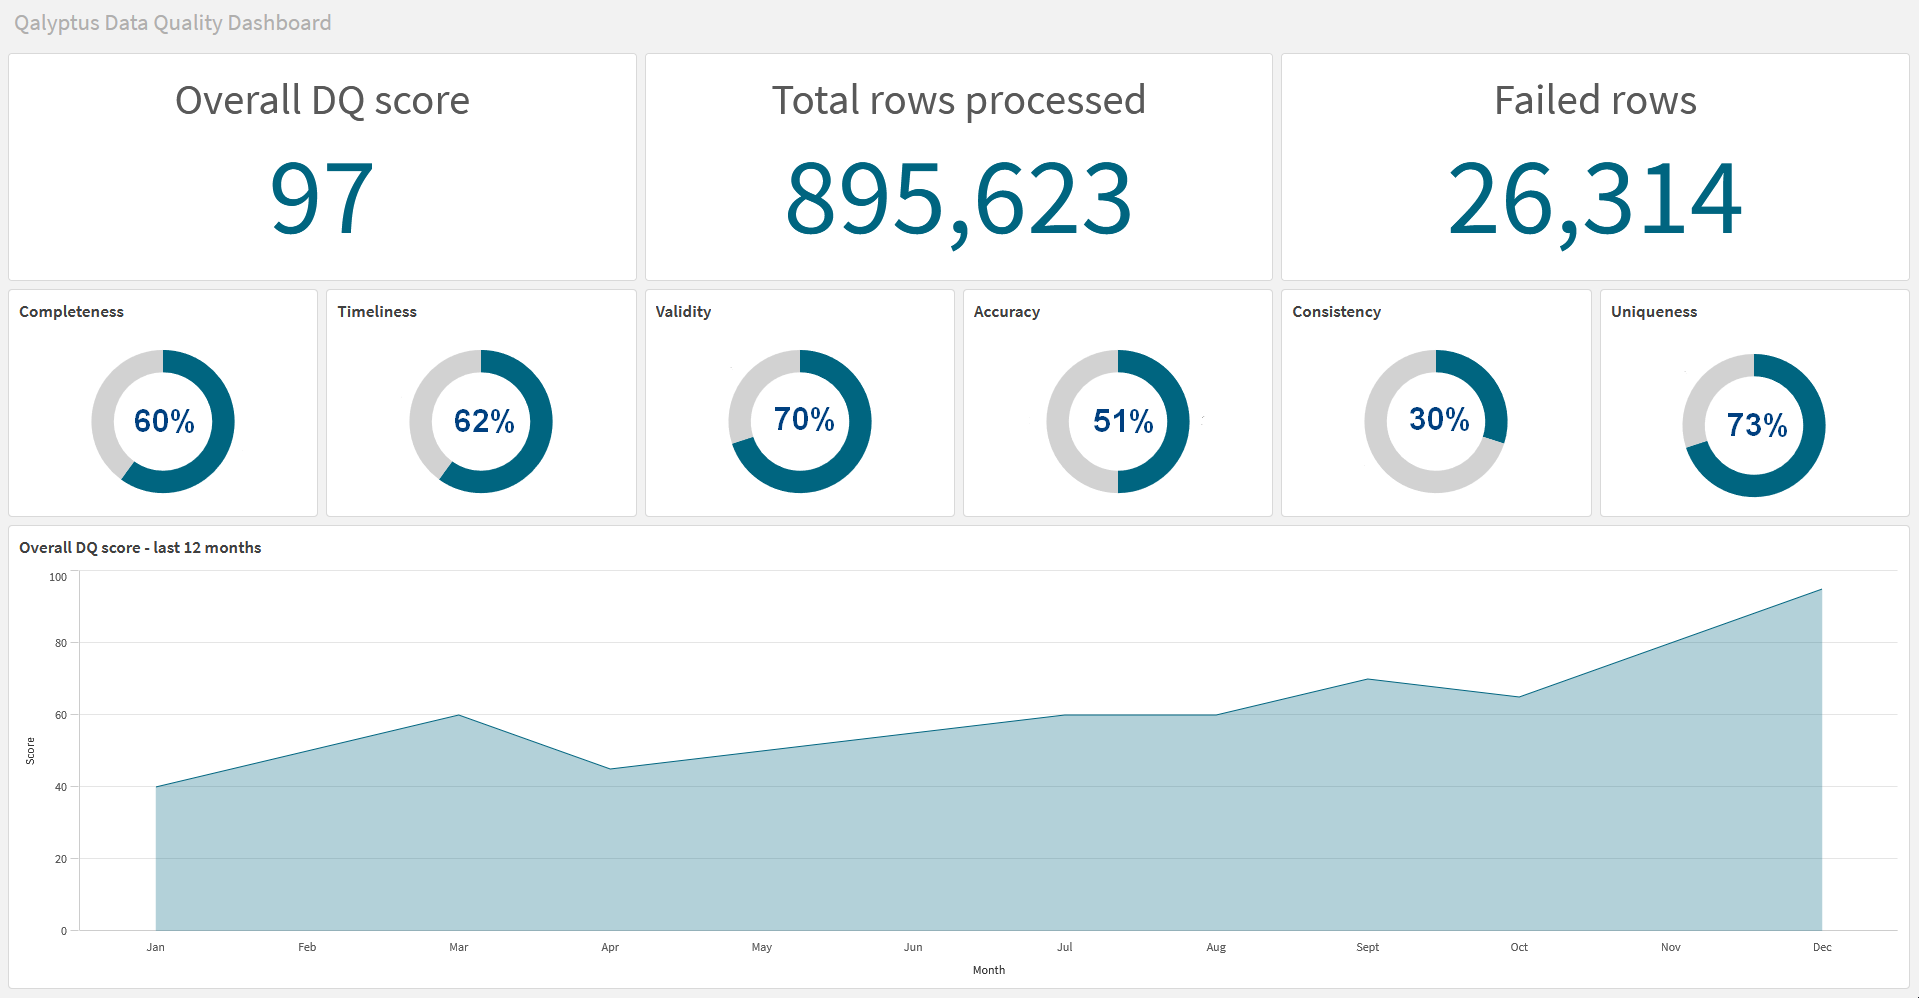
The dashboard should provide a view of the six dimensions of data quality: Completeness, Timeliness, Validity (conformity), Accuracy, Consistency, and Uniqueness.
4.1- Business rules to implement
We want to check the following business rules against a dataset stored in a table called customer.
| Rule ID | Data quality dimension | Attribute | Rule | Comment |
| Rule_01 | Validity | Where a customer has provided an email address, it should be valid. | The email should adhere to the pattern [email protected]. | |
| Rule_02 | Uniqueness | Every customer should have a unique Email. | Duplicate emails with different IDs are not allowed. | |
| Rule_03 | Completeness | Phone_num | Every customer should have a phone number, as these are used for two-factor authentication. | |
| Rule_04 | Validity | DOB | Every customer should have a valid date of birth. |
Data quality metrics to capture
For each business rule, we want to have:
- Total number of lines processed
- Total number of failed lines
- DQ score
4.2- Dashboard design
We will use the Qlik Sense script to load the Customer table and verify the four business rules we defined previously.
We will create a new column for each rule and evaluate each row’s validity to the four rules. We will use this new information to build the Data Quality Dashboard.
Please note that this method is only used to show you the process to measure the data quality. It will not be suitable in all situations, in particular, to process a large number of data. I recommend you use a data integration tool to profile your data.
This is what our table could look like:
| id | First_name | Last_name |
|
Phone_number | Date_of_birth | rule_01_validity_email | rule_02_uniqueness_email | rule_03_completness_phone_number | rule_04_Validity_dob | row_faild |
| 1 | Valentina | Holmes | [email protected] | 0606060606 | 2/10/1982 | 1 | 1 | 1 | 1 | 0 |
| 2 | Ashley | Parker | [email protected] | 0626656565 | 31/12/9999 | 1 | 1 | 1 | 0 | 1 |
| 3 | Finley | Francis | [email protected] | 0659588788 | 5/3/1986 | 1 | 1 | 1 | 1 | 0 |
| 4 | Elena | Taylor | [email protected] | 0785986532 | 15/5/1978 | 1 | 1 | 1 | 1 | 0 |
| 5 | Amina | Jackson | [email protected] | 4/8/1992 | 1 | 1 | 0 | 1 | 1 | |
| 6 | Morgan | Kelly | [email protected] | 0645326598 | 28/2/1990 | 1 | 1 | 1 | 1 | 0 |
Calculate KPIs in Qlik Sense
Using the table, we can calculate the following indicators:
- Overall data quality score (%)
Sum of rows failed / sum of rows processed:
(Sum (rows_failed) / count (id)) * 100 - Total rows processed
count (id) - Failed rows
Sum (rows_failed) - Completeness Score
(Sum (rule_03_completness_phone_number) / count (id)) * 100 - Validity Score
(Sum (rule_01_validity_email * rule_04_Validity_dob) / count (id)) * 100 - Consistency Score
(Sum (rule_03_completness_phone_number) / count (id)) * 100 - Uniqueness score
(Sum (rule_02_uniqueness_id) / count (id)) * 100
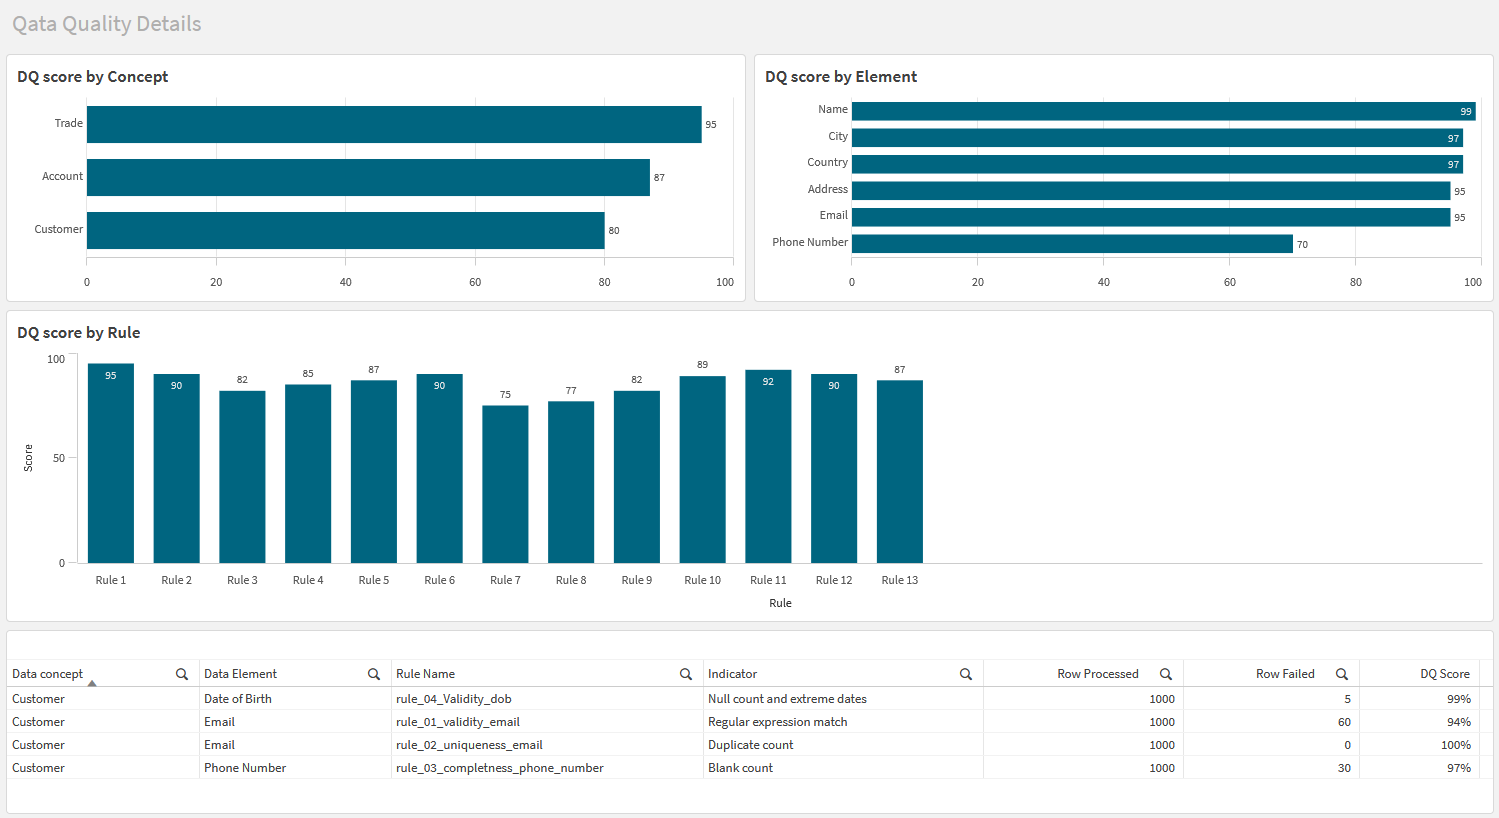
The data quality dashboard is divided into two levels:
a- Summary level – Overall data quality
The summary level displays the overall score of all profiled and monitored data.
b- Detailed rule level
The rule level displays metrics at the business rule level. This includes data such as:
- Rule name
- Data concept
- Data element
- Rule description
- Data quality dimension
- Total processed
- Total failed
- DQ score
5. Automatically distribute data quality reports with Qalyptus
After creating the Data Quality Dashboard in Qlik Sense, you can create and distribute a custom report to the Data Owners and anyone else who might be interested in monitoring data quality.
To do this, you can use Qalyptus, our reporting solution for Qlik Sense and QlikView. You can send the report in different formats: PDF, Excel, HTML, PowerPoint, …etc.
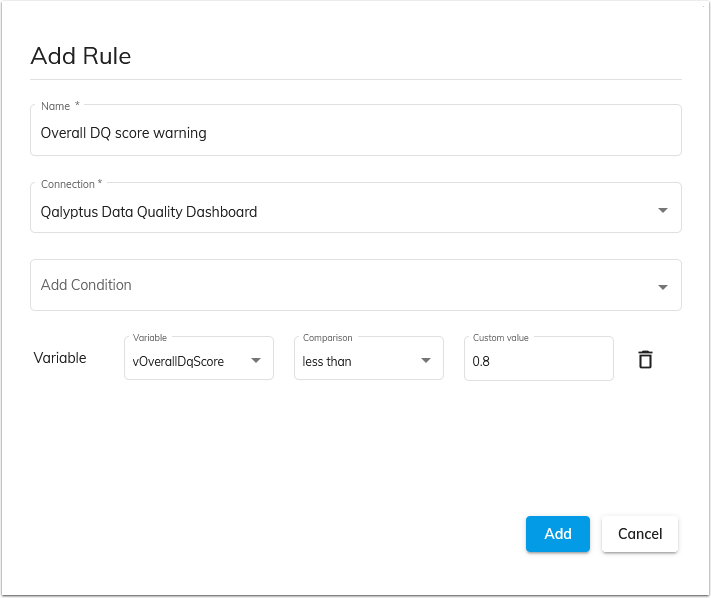
The report can be sent at a regular interval (ex. every week) or sent according to the values of the KPIs (ex. if Overall DQ score < 80%).
With Qalyptus, you can send an email and embed the Dashboard we created previously in the email message and attach an Excel file with more details.
