Qalyptus December 2020
We are happy to announce the release of the Qalyptus December 2020 version. This new version comes with many new features, improvements, and bug fixes. Another level has been crossed with this version. Here are the new features of this version:
- Repeat Excel sheet, Word page, PowerPoint slide, and HTML Div
- Add a Filter to objects
- Work with Master Items
- Not insert table rows in Excel
- Choose pivot table rows presentation
- Add object title
- Column names in tables are dynamic
- Create PowerPoint native chart
- Send reports filtering by user domain account (as Section Access)
- Qalyptus Server license is linked to your server ID
- Improvements and bug fixes
1- Repeat Excel sheet, Word page, PowerPoint slide, and HTML Div
You are familiar with Iteration reports that allow you to create several reports according to one or more dimensions based on the same Model. Example: Sales report by region, sales report by salesperson,… etc.
In this new version, Qalyptus allows repeating data by dimension in a report. You can repeat Images, Tables, and Variables. The use of this feature is appropriate for the type of report you are creating.
In Excel, you can repeat the same sheet’s contents for each value in a dimension field. You can also repeat your Qlik Sense objects on a single sheet for a field value. You can nest the repeat levels as many times as you want.
You can repeat the contents of a Word page or PowerPoint slide for each value in a dimension field.
In an HTML Template, you can repeat your Qlik Sense objects (which are inside a <div> </div> tag) for a field value. You can nest the repeat levels as many times as you want.
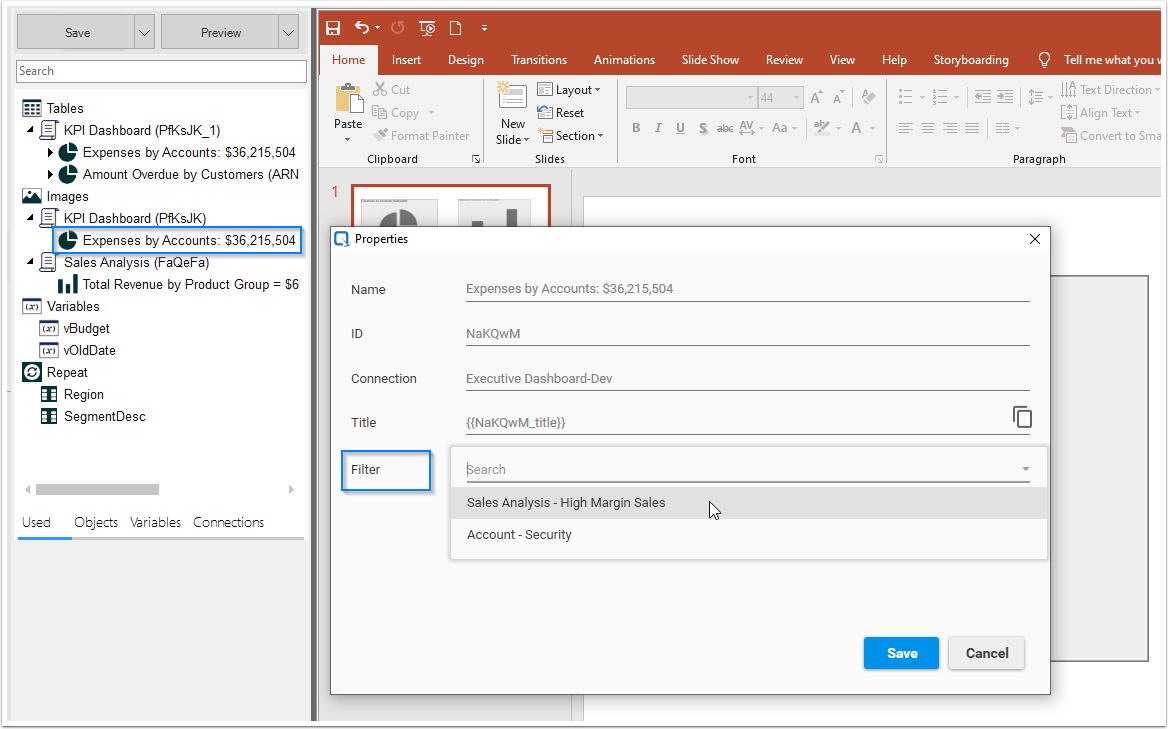
2- Add a Filter to objects
In addition to applying filters at the report level and the task level, you can now apply a filter for each Qlik object you use in your model.
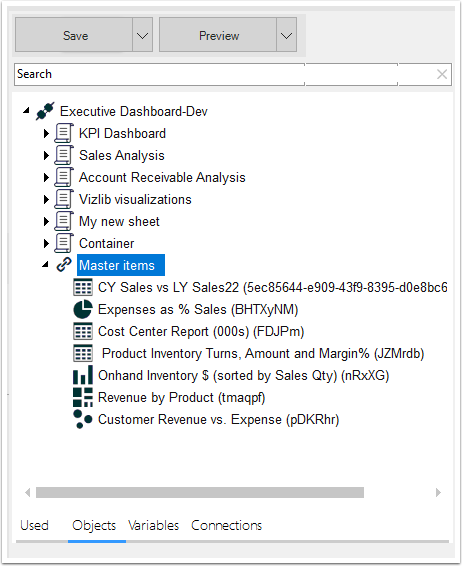
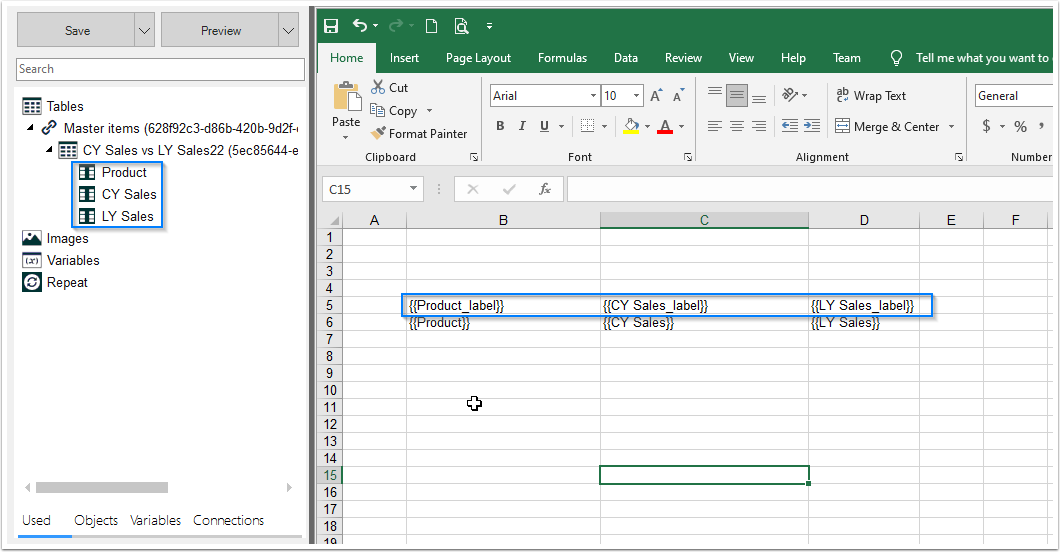
3- Work with Master Items
You want to use an object in your Template that you don’t want to display in your Qlik Sense app, now you can. Qalyptus allows you to use Master Items to create your Models. You no longer need to have all of your objects in Qlik Sense sheets.
Another use case, if you use your Master Items only in Vizlib Container, you can now use them in your Qalyptus models.
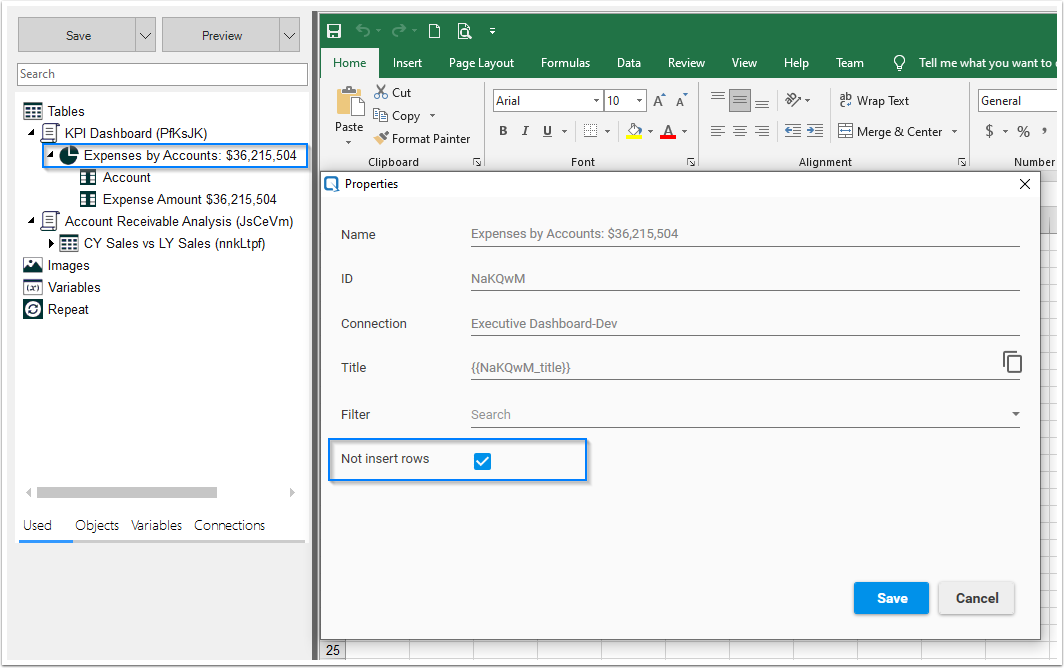
4- Not insert table rows in Excel
In Excel, when you use a table, Qalyptus, by Default, inserts new rows to keep the same layout of your different objects. But in some cases, you may want Qalyptus not to insert rows; for example, when you have several objects next to each other.
Now you have the option of telling Qalyptus not to insert rows when exporting a table.
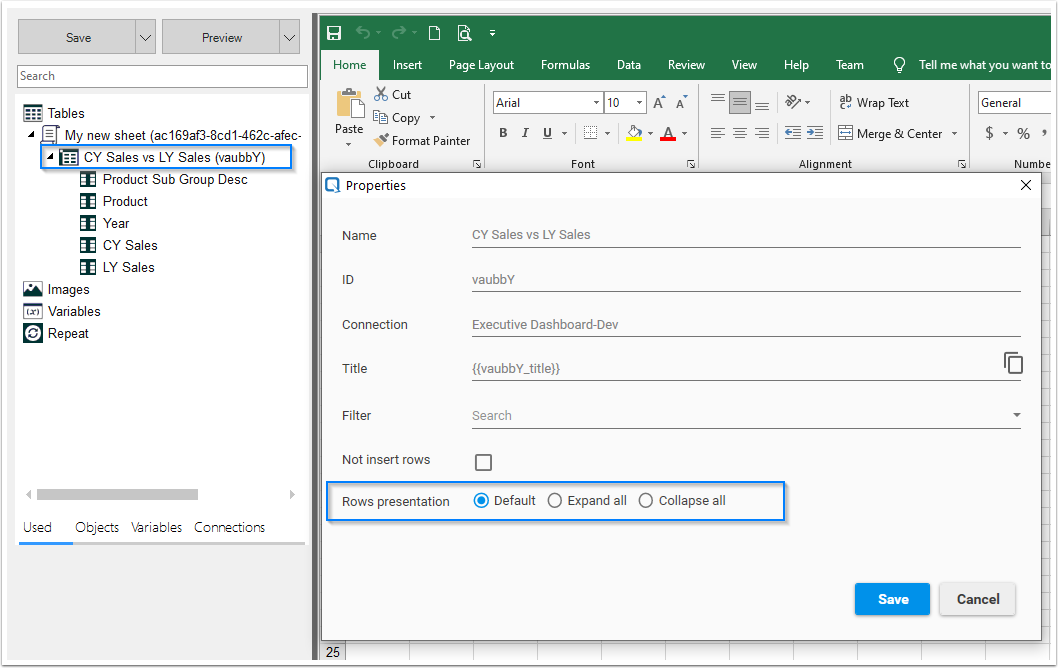
5- Choose pivot table rows presentation
You can now choose how do you want to export a pivot table. You have the choice between Default (the settings chosen in Qlik Sense), Expand all, or Collapse all.
6- Add object title
It is now possible to add the title of an object: Sheet, Chart, or Table. Right-click on the object and click on “Add title.”
7- Column names in tables are dynamic
When using a table in your model, the column names in the table were static before this release and matched the name displayed in Qlik Sense when all selections are cleared. Now, the name of the columns is dynamic.
a- If you use an expression to define a column’s name and that when generating the report, you apply a filter. Qalyptus will evaluate the expression after applying it and display the name returned by the expression.
Qalyptus will not display the column name’s expression in your model for a better experience but the column name when all selections are cleared (see below).
b- Another example, if one of the columns of the table is a Drill-down dimension (Country> Region> City) and you have applied a filter to your report on a particular Country. Qalyptus will display in the name of the column: “Region” because Qlik Sense will display “Region” in the dimension label after selecting a country.
8- Create PowerPoint native chart
If you need to, you can now create a PowerPoint chart with data from a Qlik Sense object (chart or table).
9- Send reports filtering by user domain account (as Section Access)
Before this version, you can only send a report to each recipient by email by filtering the data based on their email (send the sales report to each salesperson, each salesperson will receive his perimeter data).
You can do the same in this new version by filtering the data based on the recipient’s domain account (Domain\Username).
For more details, see this article.
10- Qalyptus Server License is linked to your server ID
For more flexibility in using your Qalyptus Server license, we have changed the license validation mode. Now the license is linked to your Windows server ID and no longer to the Qalyptus Server service username.
With this new operating mode, you can change the user who runs the Qalyptus Server service as you wish, and your license will remain valid.
11- Improvements and bug fixes
- Now you can see the stream of the Qlik Sense app in the list of Qlik Sense Apps (When you create a connection)
- Possibility to edit all user subscriptions to reports by admins
- Improvement in Filter. We have removed the ambiguity that could arise when using the feature “Clear selections.”
- Fixed bug. In some cases, cannot open PowerPoint file with Layout
Learn more about Qalyptus