Qlik Sense & Datawarehouse, the ideal configuration!
The Datawarehouse is often seen as a complex and expensive technology only within the reach of large companies and which requires high level technical knowledge. This is not quite true 😉.
This image comes from the fact that in previous years only companies that had the financial means and a critical size could justify setting up a Datawarehouse because it was expensive and time consuming to set up.
But today, all that is no longer true. With the arrival of the Cloud and more powerful open source databases like PostgreSQL, and ETLs designed for business users, any company can set up a Datawarehouse that meets its needs.
In this article, I will try to convince you not to transform your data in Qlik Sense or QlikView anymore but to do it upstream.
I would like to point out that this article is valid for companies that have a Datawarehouse and those that do not. And yes, often companies that have a Datawarehouse don’t use it efficiently in all Qlik Sense application development🙃.
What is a Datawarehouse
The good news is that a Datawarehouse is simply a database 😁 that you can create with whatever DBMS (Database Management System) you choose. Its role is to centralize all of the company’s data for storage and archiving in order to guarantee the quality and consistency of data as well as easy and governed access.
What do you say ? It’s interesting, isn’t it!
The Datawarehouse (DWH) is largely powered by transactional databases that store data related to the operational system of the company. And used as a data source by data visualization tools like Qlik Sense, QlikView and others.
We will see a little later how to proceed to create a Datawarehouse.
– Characteristics of Datawarehouse
A Datawarehouse is distinguished from other types of databases by the following elements:
- Main use: Reporting and Analysis
- Data form: Structured
- Modeling: Star or Snowflake. If you have already developed QlikView or Qlik Sense applications, then you have already modeled your data as a Star or Snowflake 😀.
- Data governance: A posteriori governance because it uses existing operational data
- Data quality: High quality because there is a data transformation and cleaning step in the Datawarehouse load process
- Integration with business applications: Mono-directional in batch mode. The transformed and cleaned data is refreshed at different frequencies (hourly, daily, weekly or monthly)
- Interactions with business users: Business users have read-only access using analysis or reporting tools
- It is mainly used for analysis processes
– Data Mart
Data Marts are not as famous as Datawarehouse, but they are also useful. We can consider that a Data Mart is a subset of the Datawarehouse whose data comes from the Datawarehouse and is aggregated and grouped functionally for a given business or team. This Data Mart will contain all the information related to the sales in an aggregated way according to different dimensions. Unlike the Datawarehouse, which presents data details for the entire company.
Why create Data Marts?
- Easy access to frequently needed data
- Create a collective view by a group of users
- Improves end user response time
- Ease of creation
- Potential users are more clearly defined than in a full Datawarehouse
- Contains only essential business data and is less cluttered
Don’t fall into the trap!
Now that we have seen what a Datawarehouse is, we are now going to look at its use (or not) when creating analysis with Qlik Sense.
Companies that use Qlik Sense without going through a Datawarehouse aren’t just companies that don’t have a Datawarehouse.
Often, Qlik Sense is bought by a business department in the company, not by the IT department. And given the ease of use of Qlik Sense, users can create applications themselves without going through the IT department by using various and varied data sources: database, Excel files, manual entry, etc. In absolute terms, this is good because it reduces the time to access information.
However, this poses two big problems for the company, that of data quality and data governance.
Going fast is good, but not at the expense of quality and governance. There is nothing worse than being in a situation where the number of customers for the marketing department is 1000 and for the sales department is 1020 😧.
Not only you could base your decisions on potentially incorrect data, but also creating a feeling of doubt as to the veracity of the data.
If you can, avoid performing your data transformations and calculations in Qlik Sense. Depending on your situation, I recommend the following:
- You don’t have a Datawarehouse: If your business is not a freelance service and you plan to grow, I recommend that you create a Datawarehouse that will grow as your business grows
- You have a Datawarehouse but some data is not available: In this case, the missing information should be added to the Datawarehouse
- You have a Datawarehouse but the data is not aggregated as you wish: In this case, promote the creation of one or more Data Marts which will contain all the information you want with the desired level of aggregation
Before creating a Data Mart, you can first use the Qlik Sense script and Set Analysis to create a first version of your application. Once the data is validated, you can use the calculation rules to build a Data Mart and then use this Data Mart as a data source.
Below, we’ll see the benefit of doing it this way.
The advantage of using a Datawarehouse with Qlik Sense
Using the Datawarehouse exclusively as a data source seems very constrained and not very agile. It can also be seen as a waste of time. I absolutely do not agree!
It can be a waste of time in the short term, but in the long term it is a huge time and energy saver. A company must have a long term vision.
I will try to illustrate the advantage of using a Datawarehouse in Qlik Sense with an example:
You want to calculate the number of active customers on your product platform.
Method 1
You use the Customer table and the Event table to calculate the number of customers who have taken a certain number of actions during a given period.
You load the data from these two tables into Qlik Sense and calculate the number of active customers using Set Analysis.
Example: =Count ({ distinct<event_type = {‘xxxx’}, event_date= {>=’dddd’} >} id_customer)
Advantage of this method:
The number of customers indicator is calculated very quickly and easily.
Disadvantage of this method:
The calculation rule is implemented in Qlik Sense and this can cause a number of issues:
- Opaque calculation rule: Other users can use another rule to calculate an indicator with the same name
- Difficult documentation: Usually, calculation rules are not documented in Qlik Sense, which makes interpretation of numbers confusing. Everyone can have their own definition
- Difficult maintenance: If in the future the definition of active customers changes in the company. It will be necessary to change in all the applications and in all the tools where the indicator is calculated. Misery !
- If your company decides, for one reason or another, to change Qlik Sense to another tool, all your work has to be redone. I don’t want to be in your place!
Method 2
You decide to calculate the “number of active customers” indicator in your Datawarehouse.
In this case, you use, as in method 1, the two tables Customer and Event to add to the table Customer (or another linked table) the boolean field is_active (1/0).
And in your Qlik Sense app, you create an expression like: =Sum(is_active)
Advantage of this method:
- The indicator is created in one place, which makes sure that everyone is using the same calculation rule
- We can’t optimize more! Calculation is done at the Datawarehouse level, this optimizes the refresh time of the Qlik Sense application and provides a better experience for the user
- Easily produced documentation: Generally, when creating a Datawarehouse, all the fields are documented (Type, definition, change history, etc.). By using specialized tools or by creating a Qlik Sense application, you can very easily access the definition of the indicator.
- Easy maintenance: Since the indicator is created in one place, its modification will be replicated automatically in the tools where it is used. It’s better, isn’t it!
Disadvantage of this method:
The downside to this method is that it can seem long and tedious, and in some cases requires skills that the Qlik Sense developer does not have.
In terms of slowness, as I said before, in the long term this disadvantage will turn into an advantage. The creation of new applications and the maintenance of existing applications will be faster.
As for the skills needed to create and manage a Datawarehouse, I told you in the introduction, we are no longer in the 90s 😁. I’ll show you that it’s not that complicated.
Create a Datawarehouse when you’re a small/medium size business
When you work in a large company with a lot of data, setting up a Datawarehouse is a given. Large companies are able to put the financial and human resources necessary to create it.
But if you work in a small/medium size company with limited financial means, the question of creating a Datawarehouse arises. Because once again, the Datawarehouse is associated with complexity and high cost.
I will now show you concretely how you can create a Datawarehouse with your knowledge as a BI developer and with a limited budget.
To do this, I will give you an example of tool or service that you can use at each stage of the creation. Note that these tools and services will not necessarily be suitable for large companies.
1- Model the Datawarehouse
The first step is to model the final database (Datawarehouse). Set the scope by determining user needs and levels of aggregation. Identify the data sources to use.
2 – Choose a DBMS
I suggest you use PostgreSQL. A free and super powerful tool. You can install it on your company’s servers or subscribe to a hosting service that will relieve you of all infrastructure and security management. To start, you can for example choose DigitalOcean. A 100% managed database with 10GB storage for just $15 per month.
3- Create the structure
Create the different tables and the different fields that will constitute your Datawarehouse. The different tables must be linked together by following a Star or Snowflake schema. Learn more about Star and Snowflake Schema. You must have a minimum of knowledge in SQL.
4- Load the database
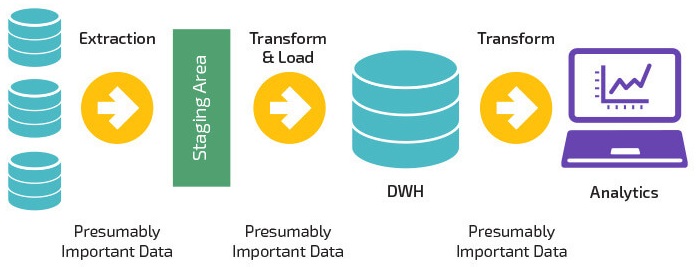
Now that you’ve created your database, it’s time to populate it from the different sources. For this, you will use an ETL (Extrat Transform Load) tool. With the ETL, you will extract the data from the different sources, then clean them and transform them if necessary and calculate the different indicators, and load the result in the Datawarehouse.
There are several ETL products, some are complex, useful for large companies with complex architecture. For a small/medium size business, I recommend using an easy-to-learn ETL designed specifically for business users. I chose EasyMorph, it is easy to use and the prices are very reasonable. There is also a free version.
To go further with business intelligence modeling with PostgreSQL, download the guide Data warehousing with PostgreSQL.
Subscribe 👇 to be notified of the publication of future articles.
Consider sharing this article!