Use data analytics with Qlik to improve your sales
Nowadays, competition is fierce, and you must find a way to stand out from your competitors. You need to keep abreast of progress, look out for changes and learn how to use the innovations of your sector to improve your sales.
In this article, you will see the benefit of relying on your data to promote your growth.
Business Intelligence analysis tools allow you to obtain vital information about your customers, your competitors, your market, and your products, enabling you to transform the way you sell.
Teams relying on data analysis quickly increase their revenues and profits. Whether you’re looking to raise up-sell opportunities, increase your average basket, gain market share, or build your pipeline, data has become the key to sales success.
As you understand it, your commercial teams must have access to in-depth and relevant information on their respective tasks and your business.
The data processing and analysis will then be necessary for each of you, from the preparation and planning of customer interactions to the final decision-making on market penetration strategies.
In this article, you will see how your sales data can be analyzed and how Qlik can help you.
1- KPIs to monitor
KPI stands for Key Performance Indicator.
They are measurable elements that you must determine yourself to improve the performance of your actions, according to your needs and what you wish to monitor in your company.
KPIs require daily attention and must be analyzed using dashboards.
If you start an online business and want to boost your sales, you may want to look out at some of these KPIs:
- Number of visits on your website
- Pages per visit
- Organic traffic
- Customer acquisition cost
- Conversion rate
- Retention rate
- Average sales per day/month/year
- New and returning users
- Rate of return
- Shopping cart abandonment rate
- Churn Rate
- Average basket
If you want to increase your notoriety and acquire new customers thanks to your e-mailing campaigns, you will rather keep an eye on:
- Average e-mail open rate
- Click rate
- Bounce rate
- Unsubscribe rate
- Deletion rate
You will determine your own KPIs depending on the action you want to perform. These indicators are based on your commercial and marketing strategies and precisely what you want to develop further.
To analyze them, you will need a good dashboard, clear, precise, and understandable for all your sales teams.
2- The best Qlik dashboards to exceed your business objectives
Now you have clearer ideas on the metrics you want to verify and monitor to grow your business, and you just need a tool to put it all into practice.
Using Qlik Sense and QlikView, you can create dashboards from your data to manage your sales and marketing actions and track your prospecting activities.
These tools also allow you to incorporate external data such as demographic, geographic, weather, and others to deepen your sales analysis.
Different types of dashboards are adapted to your needs:
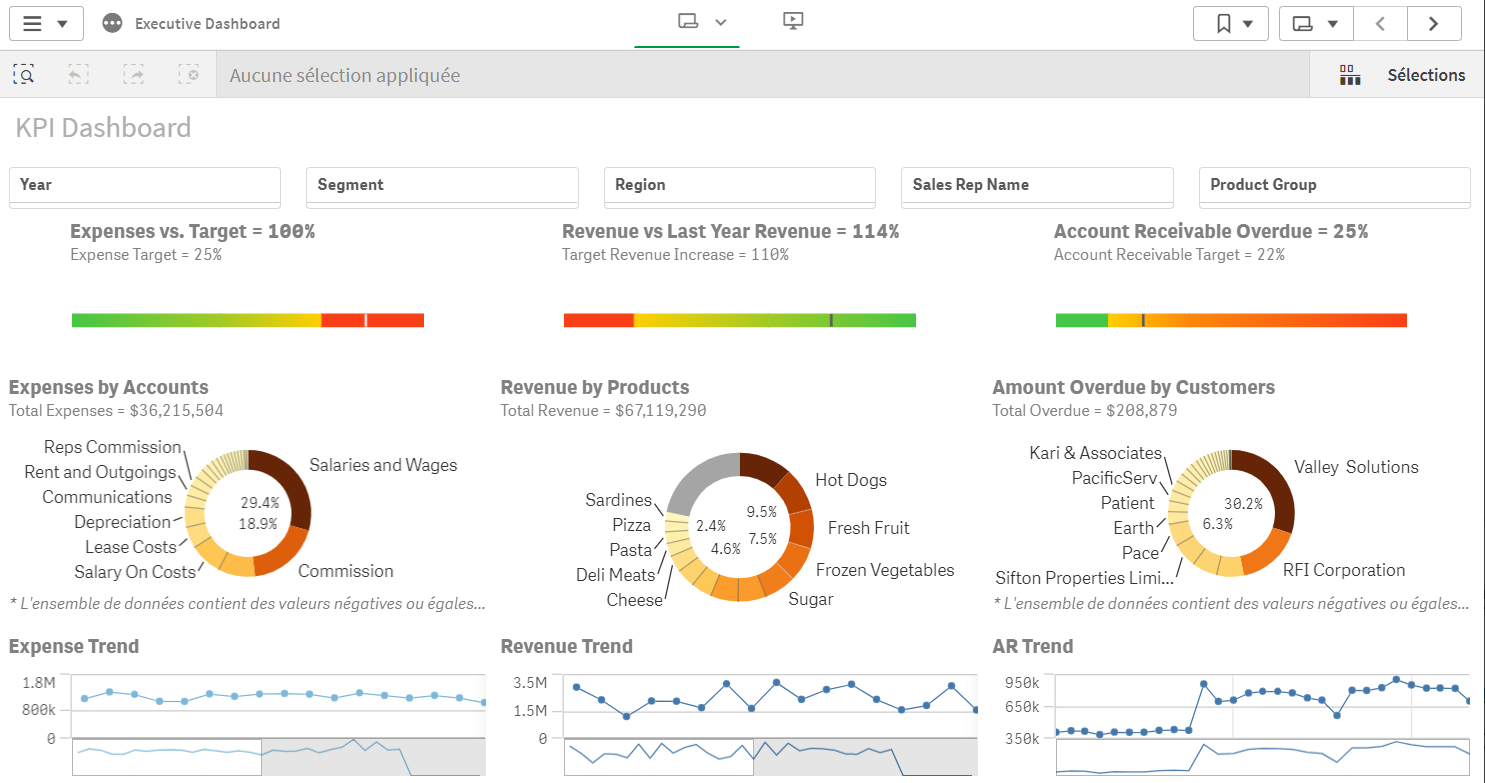
2.1- The executive dashboard
This dashboard is mainly used by business managers and directors.
The analysis of your KPIs will help you to develop and improve your strategies in the long term.
This dashboard allows you to :
- Target your goals precisely
- Highlight progress made according to the set goals
- Be reactive to changes using recent data
- Highlight key indicators related to management, customer experience, and team motivation.
- Optimize your product and price ranges
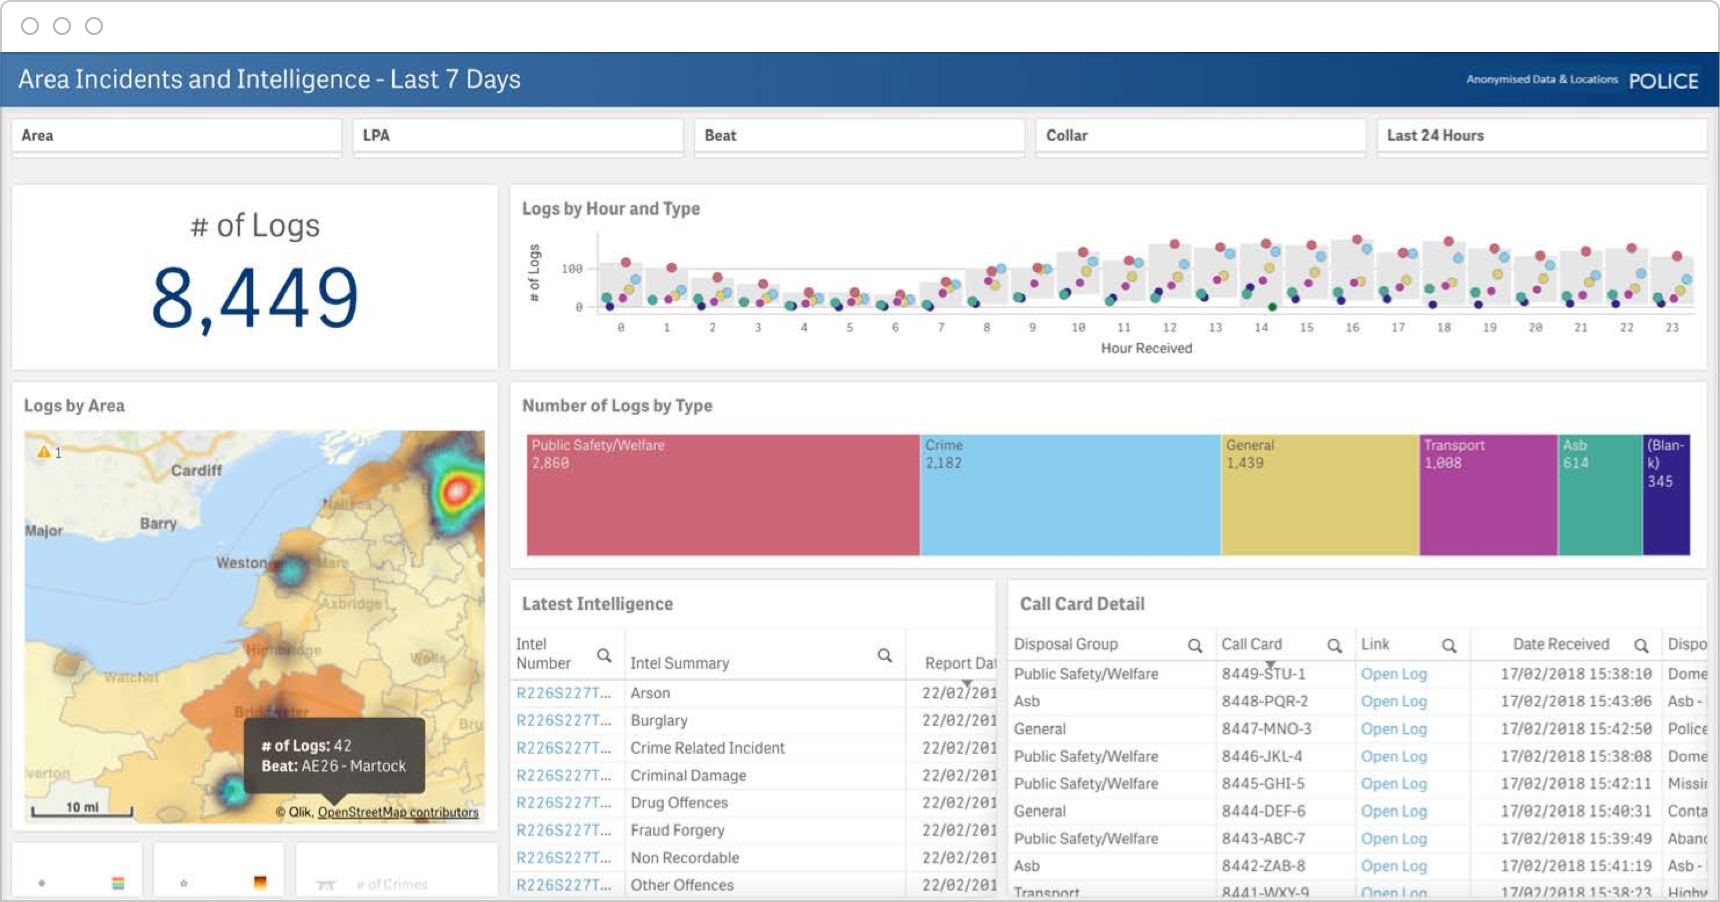
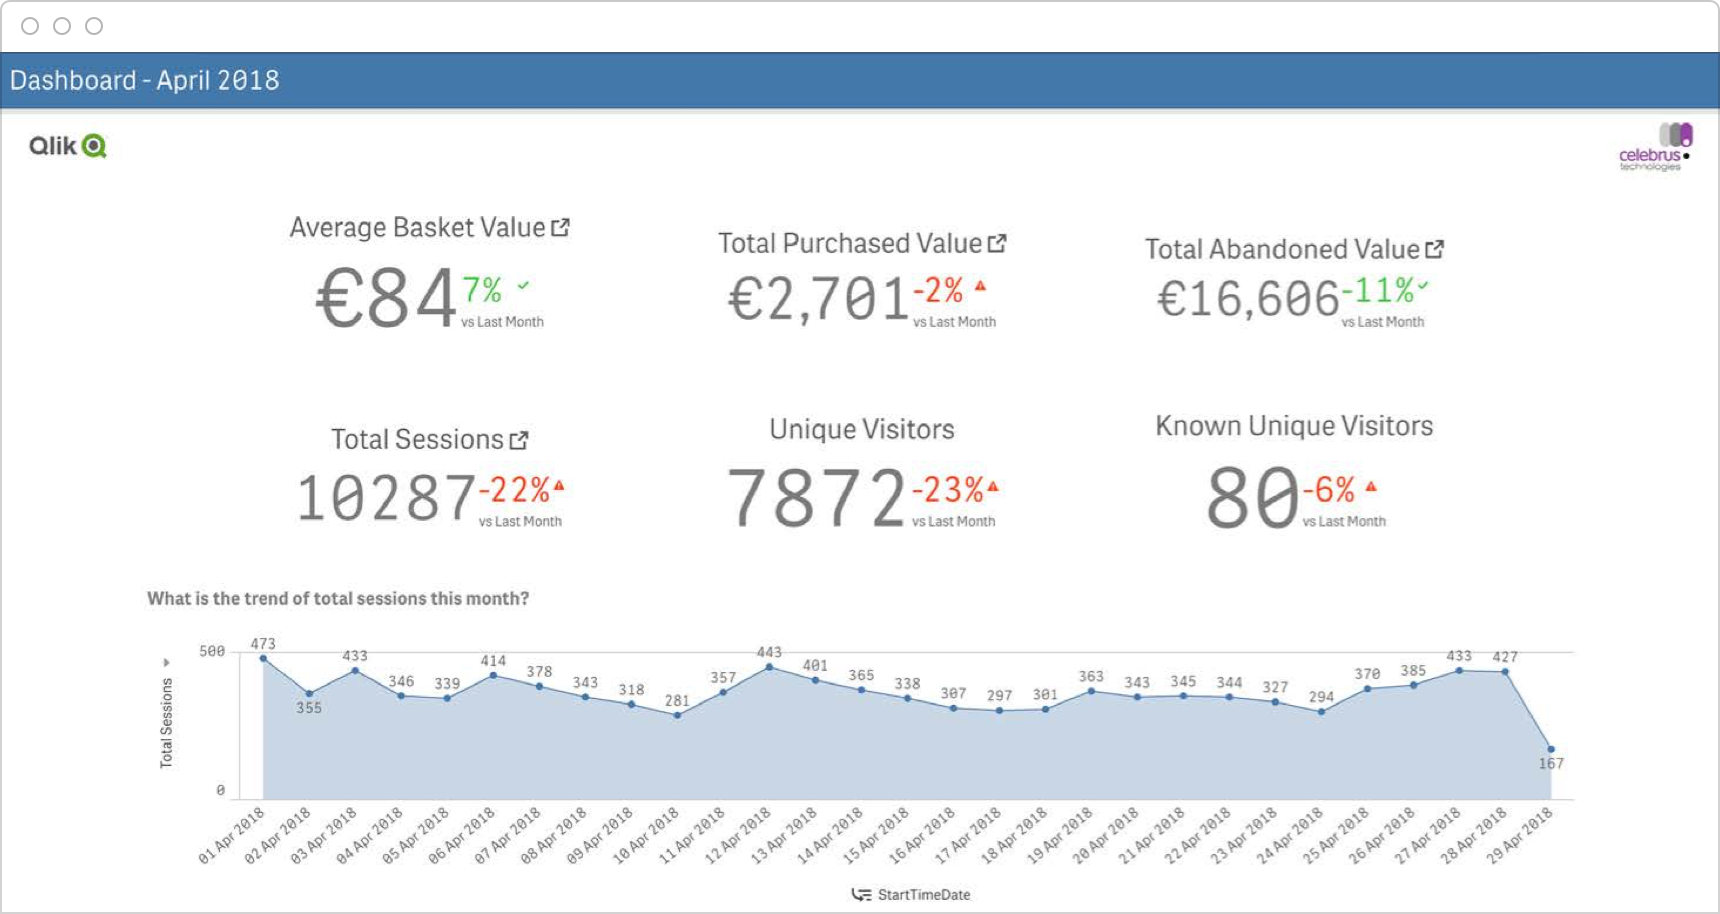
2.2- The operational dashboard
This dashboard is the most widely used, easy to handle, and allows you to follow your company’s activities daily.
Moreover, it is used to give an overview of the situation and not highlighting the progress of the objectives.
An operational dashboard allows you to :
- Stay informed of daily tasks
- Gain efficiency through visualizations
- Pilot the activity using the different functionalities
2.3- The tactical dashboard
The Tactical Dashboard is used to track corporate or team project objectives.
Interactive dashboard type is essential to help decision-making and the implementation of strategic change.
This dashboard allows to :
- Monitor company growth with the right tools
- Highlight KPIs using interactive features
- Minimize your risks
- Enabling cost-effective discoveries
- Strengthen the link between your sales and finance teams
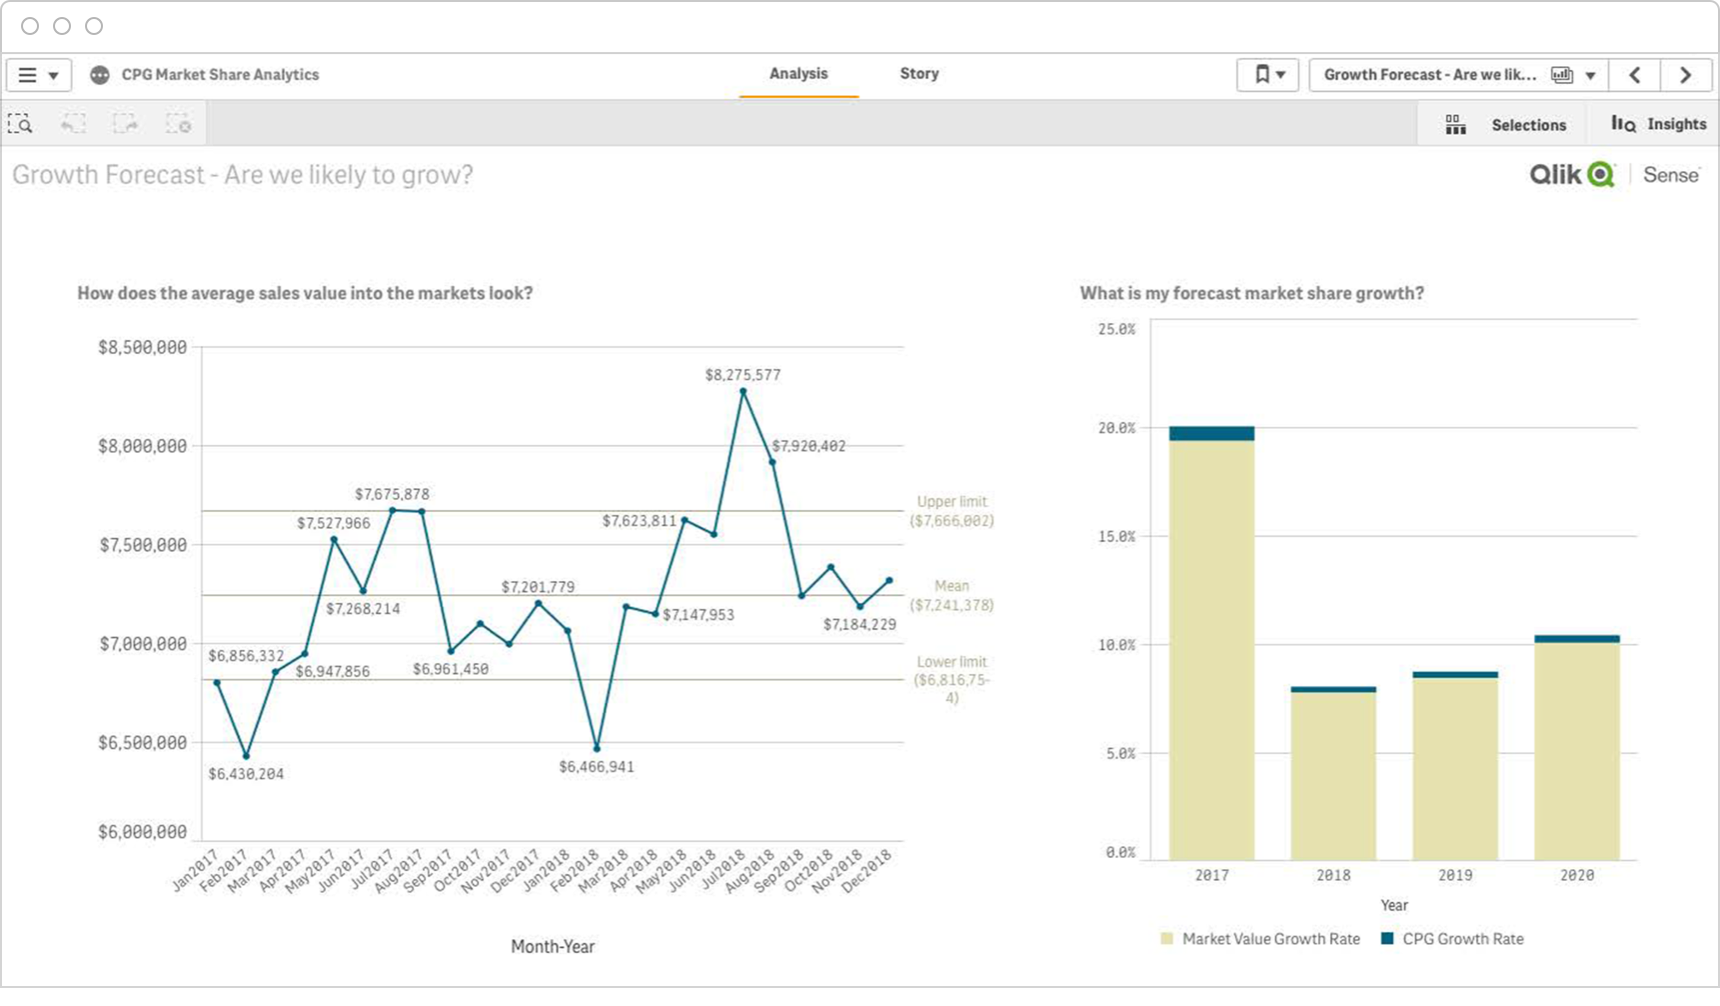
2.4- The analytical dashboard
The analytical dashboard is designed and used by analysts to create a support for managers in their strategic decisions. This predictive dashboard highlights the company’s data to facilitate decision-making and estimate the increase in its market share.
It allows to :
- Track market trends over time with the help of visualizations
- Compare your objectives with reality market
- Create better predictions for your business
- Use external variables such as demographics, weather, and other data to refine your measurements
3- Reviewing before publishing your dashboards
Before publishing and sharing reporting, remember to check the following:
- Make sure that your metrics and questions match the story you want to expose
- Remove irrelevant items and that may confuse your users
- Make sure that your report is in line with your company’s graphic chart
- Test your visualizations with your colleagues and take into account their feedback
- Feel free to add CTA to engage your audience to perform certain actions
Don’t hesitate to get closer to the 8 Best practices for designing dashboards with Qlik Sense to take full advantage of the software’s features.
4- Share your dashboards quickly with Qalyptus
You can then easily share your reports using Qalyptus.
Our reporting solution will allow you to send your reports in different file types (PDF, Excel, HTML, PowerPoint,…) to the people of your choice and in an automated way.
You can decide to send your report either at regular intervals or according to your own indicators.
With Qalyptus, you can also attach in your e-mail an Excel file to provide additional details to your report.
Learn more about Qalyptus